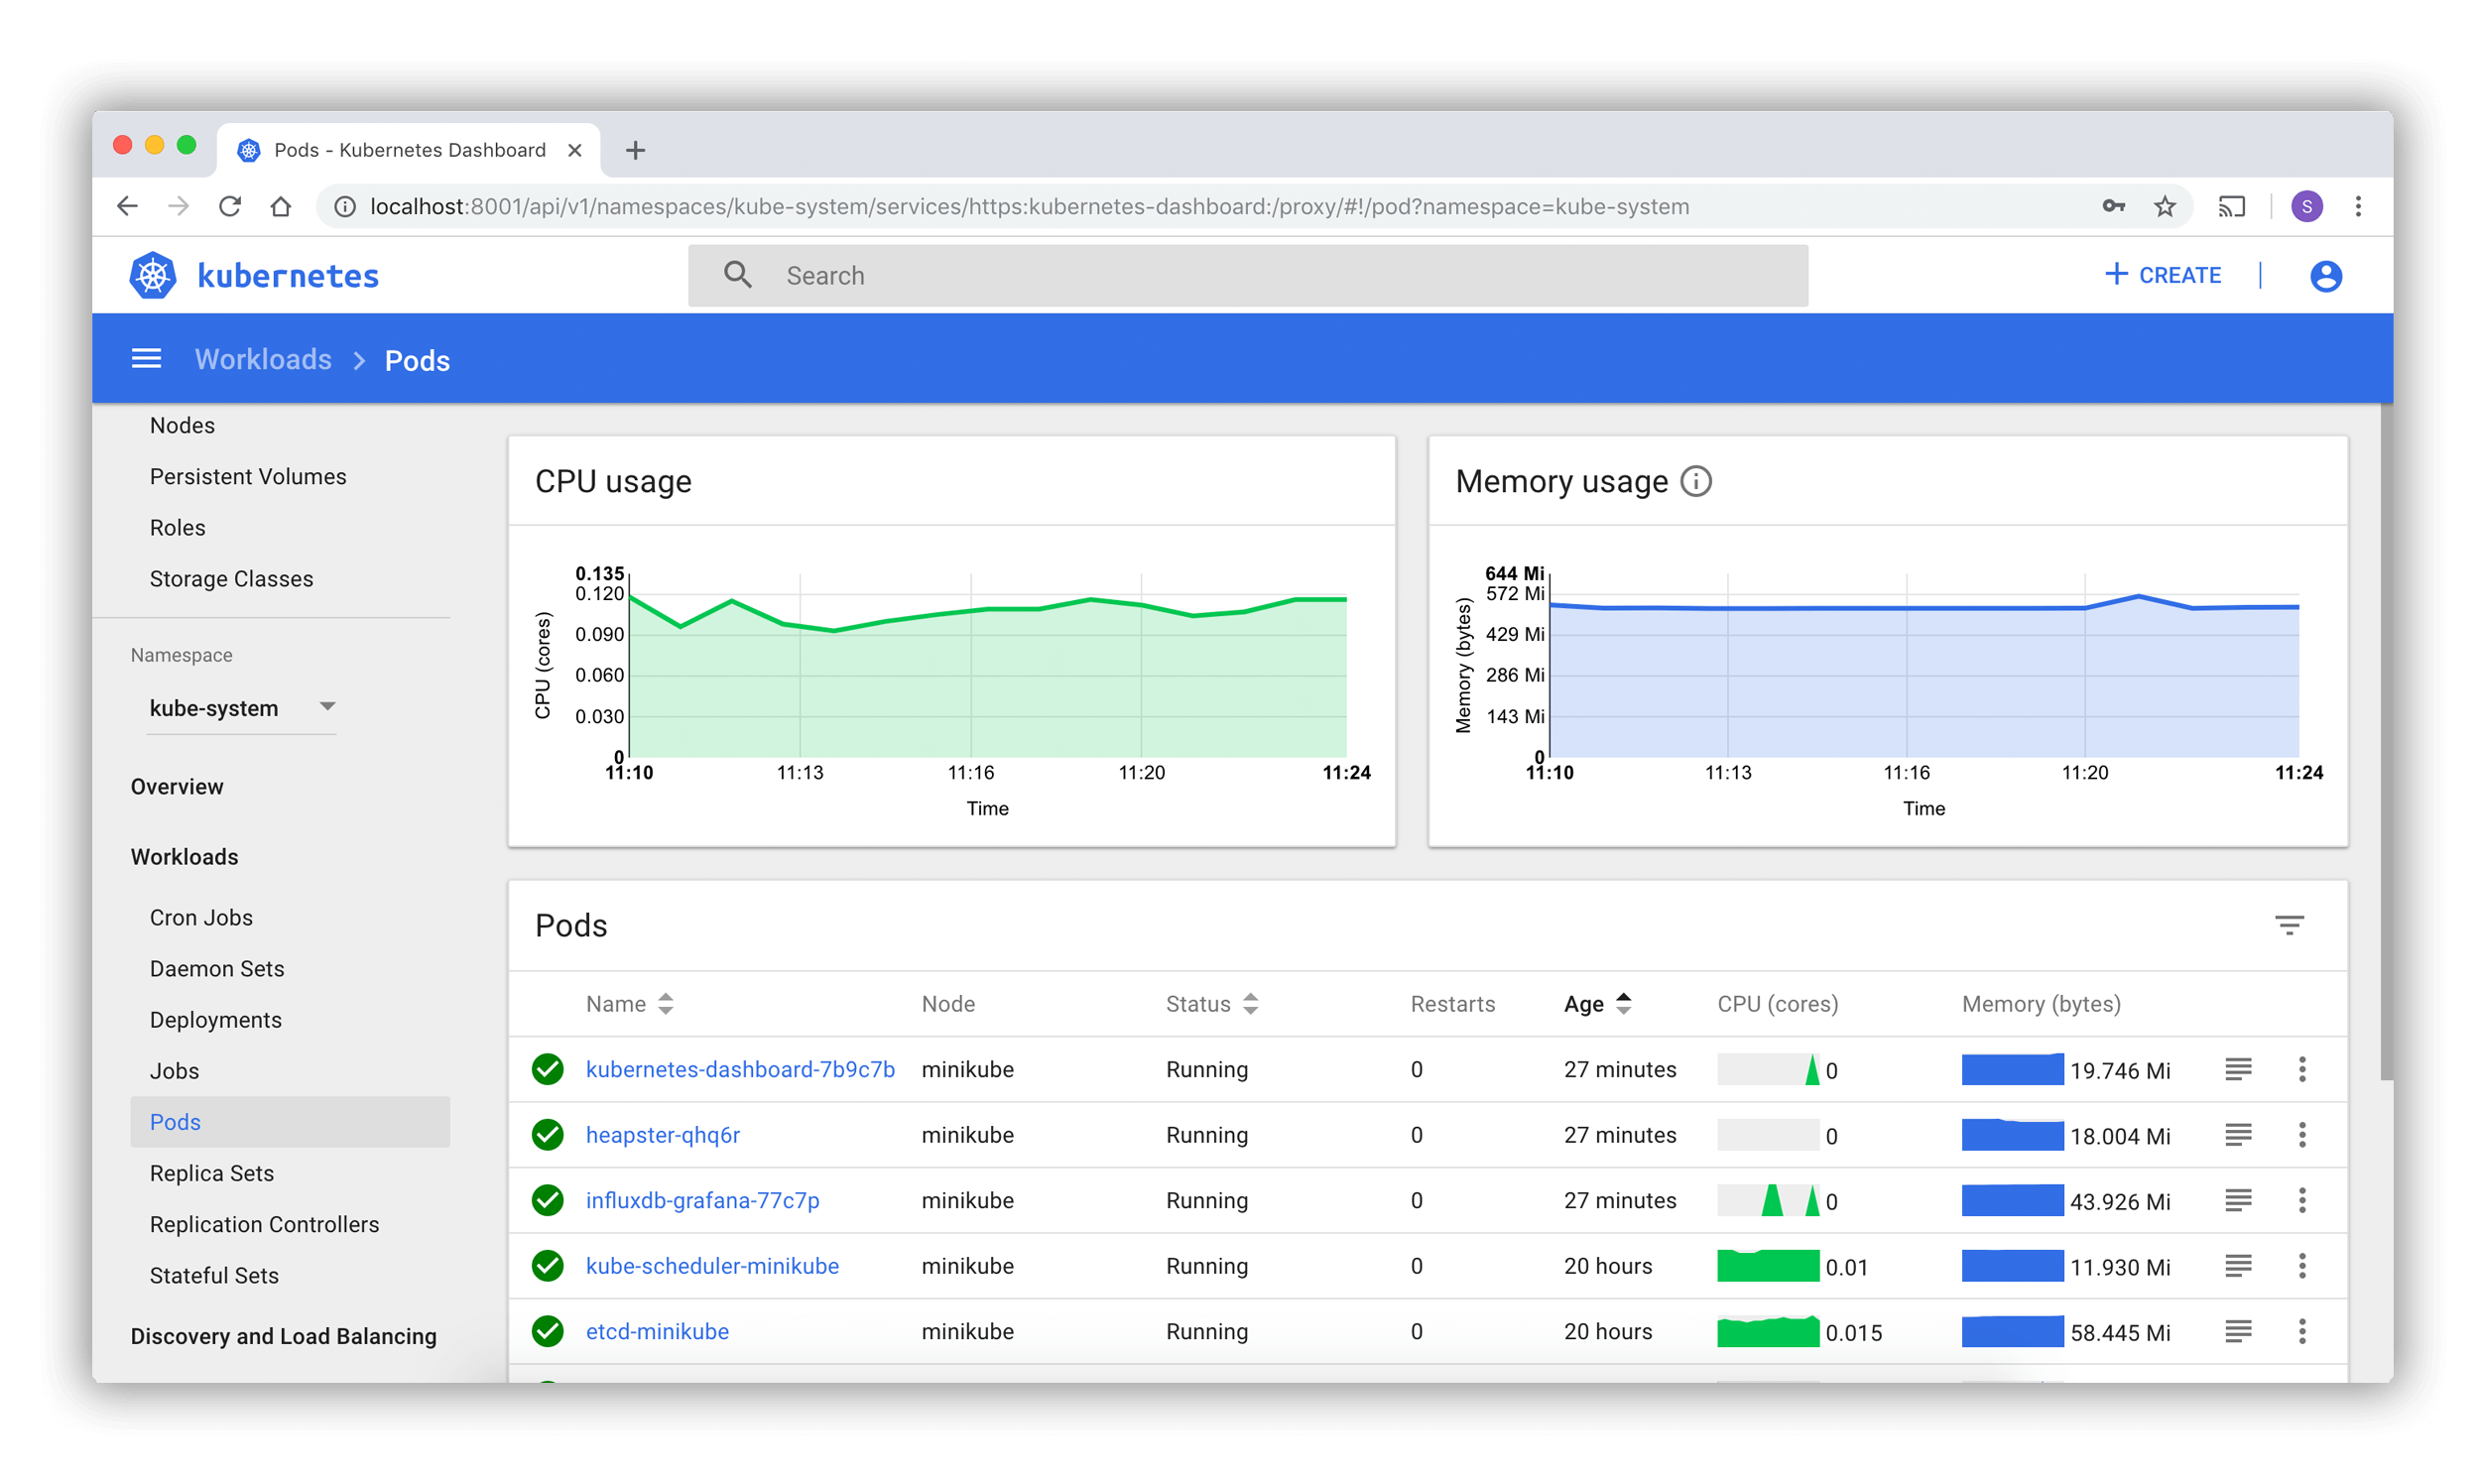
Kubernetes- Dashboard UI
Dashboard is a web-based Kubernetes user interface. You can use Dashboard to deploy containerized applications to a Kubernetes cluster, troubleshoot your containerized application, and manage the cluster resources. You can use Dashboard to get an overview of applications running on your cluster, as well as for creating or modifying individual Kubernetes resources (such as Deployments, Jobs, DaemonSets, etc). For example, you can scale a Deployment, initiate a rolling update, restart a pod or deploy new applications using a deploy wizard.
Dashboard also provides information on the state of Kubernetes resources in your cluster and on any errors that may have occurred.
LAB
kubectl apply -f https://raw.githubusercontent.com/kubernetes/dashboard/v2.0.1/aio/deploy/recommended.yaml
kubectl get svc -n kubernetes-dashboard
kubectl edit svc kubernetes-dashboard -n kubernetes-dashboard
#Modify the type: ClusterIP to NodePort
kubectl get svc -n kubernetes-dashboard
# You will find a port number which is in between 30K to 32767
Take the public IP or localhost and use the port number to visit the dashboard on the browser
--
Create service account
kubectl create serviceaccount cluster-admin-dashboard-sa
Bind ClusterAdmin role to the service account
kubectl create clusterrolebinding cluster-admin-dashboard-sa --clusterrole=cluster-admin --serviceaccount=default:cluster-admin-dashboard-sa
Parse the token
TOKEN=$(kubectl describe secret $(kubectl -n kube-system get secret | awk '/^cluster-admin-dashboard-sa- token-/{print $1}') | awk '$1=="token:"{print $2}')
Print the token value
echo $TOKEN
Comments
Post a Comment